Skewed Data
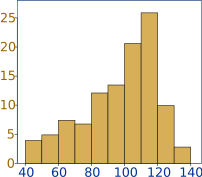
Data can be "skewed", meaning it tends to have a long tail on one side or the other:
 |
 |
 |
||
| Negative Skew | No Skew | Positive Skew |
Negative Skew?
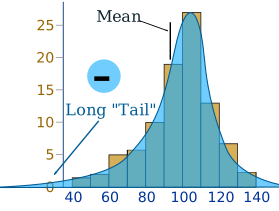
Why is it called negative skew? Because the long "tail" is on the negative side of the peak.
Some people say it is skewed left, meaning the long tail is on the left hand side
In a negative skew, the measures of central tendency are pulled in different directions:
- The Mode is at the highest peak
- The Median is left of the peak
- The Mean is pulled furthest left by the long tail
So: Mean < Median < Mode
The Normal Distribution has No Skew
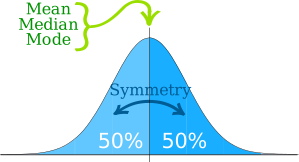
A Normal Distribution isn't skewed.
It is perfectly symmetrical.
And the Mean is exactly at the peak.
Positive Skew

And positive skew is when the long tail is on the positive side of the peak
Some people say it is "skewed right".
The mean is on the right of the peak value.
Example: Income Distribution

Here's some data extracted from a recent Census.
As you can see it is positively skewed ... in fact the tail continues way past $100,000
Quick Question: A bakery usually sells 10 to 15 cakes a day. But on a few holiday days they sell over 100 cakes. Is this data skewed left (negative) or right (positive)?
Answer: It is skewed right (positive skew), because the rare high-sales days create a long tail on the positive (right) side of the graph.
Calculating Skewness
"Skewness" (the amount of skew) can be calculated, for example you could use the SKEW() function in Excel or OpenOffice Calc.