Transforming Data
Sometimes we need to change an entire set of data. We might want to add 5 points to everyone's test score, or convert measurements from feet to meters.
When we do this, it is called a Linear Transformation.
The Two Ways to Transform
There are two main things we can do to our data:
- Addition (or Subtraction): Slides the data
- Multiplication (or Division): Stretches or shrinks the data
Real World Examples
Addition: The Train

Imagine a train with several carriages. When the train moves 10 meters forward, every single carriage moves 10 meters forward.
- The Middle (Mean/Median) moves forward by 10
- The Length of the train (Range) stays exactly the same!
Multiplication: The Rubber Band
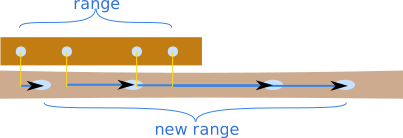
Imagine circles marked on a rubber band. When we stretch the rubber band to double its length:
- The Positions (Mean/Median) all move further away from the start
- The Gap between the circles (Range/Spread) also doubles!
A quick guide:
| Measures | Addition (+5) | Multiplication (×2) |
|---|---|---|
| Mean, Median, Mode | Adds 5 | Multiplies by 2 |
| Range, Standard Deviation | Stays the Same | Multiplies by 2 |
Watch Out for Variance
Variance is the square of Standard Deviation, so has its own rules.
If we multiply all data values by 2:
- The Standard Deviation multiplies by 2
- The Variance multiplies by 22 = 4
Examples
Example 1: Bonus Points (Addition)
A class takes a test and the results are: 60, 70, 80.
- Mean = 70
- Range = 20
The teacher adds 10 bonus points to every score. The new scores are: 70, 80, 90.
- New Mean = 80 (70 + 10)
- New Range = 20 (It didn't change!)
Example 2: Currency Conversion (Multiplication)
You have prices in Dollars: $10, $20, $50.
- Mean = $26.67
- Range = $40
To convert to a different currency, you multiply by 2. The new prices are: 20, 40, 100.
- New Mean = 53.34 (26.67 × 2)
- New Range = 80 (40 × 2)
Summary
- Measures of Center (Mean/Median) follow all changes
- Measures of Spread (Range/Std Dev) only care about multiplication!