Activity: From Table to Graph and Equation
In this activity we learn how to:
- Draw the graph from a table of values
- Write an equation from a table of values
Tables, equations and graphs are just different ways of showing the same function.
What's a Function?
A function is a rule that takes an input value (x) and produces exactly one output value (y) for each x.
We can show a function many ways including:
- a table of values
- an equation
- a graph
Example Table
| x | y |
|---|---|
| 1 | 3 |
| 2 | 5 |
| 3 | 7 |
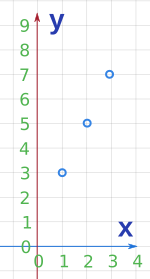
Drawing the Graph from a Table
To draw a graph from a table:
- Draw horizontal and vertical axes
- Label the horizontal axis x and the vertical axis y
- Plot each pair of values (x, y) as a point
Writing the Equation
Let's assume the function is a straight line, because the points look evenly spaced.
A straight line follows this form:
y = mx + b
- m is the slope (how much y changes when x goes up by 1)
- b is the y-intercept (the value of y when x = 0)
From the table:
- Every step right adds 2, so m = 2
- To find b, go backward 1 step from x = 1 (y = 3):
When x = 0, y = 3 − 2 = 1, so b = 1
Equation: y = 2x + 1
Drawing the Graph from an Equation
Start with the equation:
y = 2x + 1
we can:
- Choose several x-values
- Calculate the matching y-values
- Make a table
- Plot and join the points
| x | y |
|---|---|
| 0 | 1 |
| 1 | 3 |
| 2 | 5 |
| 3 | 7 |
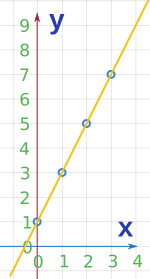
Try testing different values for m and b in our Function Grapher to see how the line tilts and shifts!
A Different Kind of Pattern (Curved Graph)
Not all patterns have a constant change.
When the change itself changes, the graph is curved instead of straight.
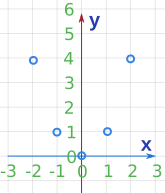
Example Table
| x | y |
|---|---|
| −2 | 4 |
| −1 | 1 |
| 0 | 0 |
| 1 | 1 |
| 2 | 4 |
Here the change in y isn't the same each time.
Graphing the Pattern
We graph it the same way:
- Plot each (x, y) point
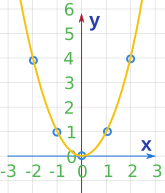
- Do not join with straight lines
- Draw a smooth curve through the points
Looking for the Rule
Curved patterns often come from equations with x2.
This curved graph may be a parabola.
Let's test a simple rule:
y = x2
Let's try some sample values:
In fact our equation matches every row of the table. This may be a coincidence, but let's go with it!
Your Turn
Question 1
| x | y |
|---|---|
| 1 | 5 |
| 2 | 8 |
| 3 | 11 |
- Plot the graph
- Find the equation
Question 2
| x | y |
|---|---|
| −2 | 6 |
| −1 | 3 |
| 0 | 2 |
| 1 | 3 |
| 2 | 6 |
- Plot the graph
- Find the equation
Check Your Work
Your table, equation and graph should all agree.
- Points from the table lie on the graph
- The graph shape matches the pattern (line or curve)
- The equation works for every row
Challenge
Create your own pattern.
- Choose a linear or curved rule
- Make a table with at least 4 rows
- Write the equation
- Draw the graph
- Explain how the table shows the shape of the graph